We Already Have the Tools to Identify Environmental Injustice
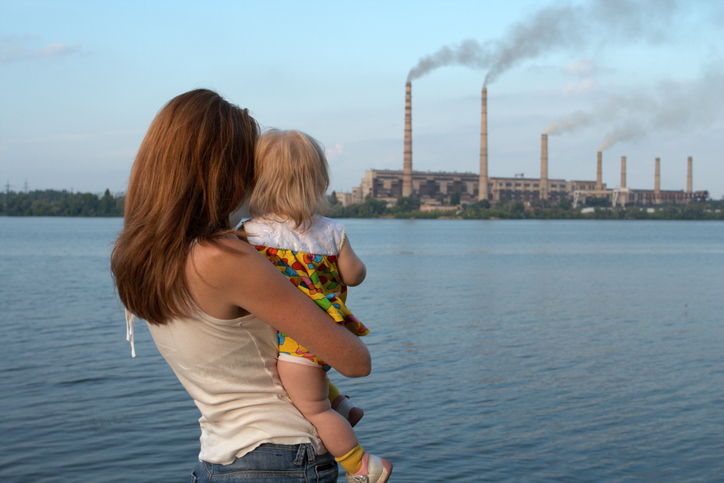
Environmental justice is part of the effort to address the challenges of racial and economic disparities in our society that affect not only housing, employment, and education, but the air we breathe, the water we drink and more.
We see these disparities in everything from Flint, Michigan’s drinking water, to the relationship between poor air quality and COVID-19 mortality, to threats driven by climate change such as more frequent heat waves and flooding that pose a greater threat to already-vulnerable populations.
In 1994, Executive Order 12898 introduced the first federal focus on environmental justice. The order directed federal agencies to address inequities in environmental and health impacts, with an emphasis on communities with large minority or low-income populations. These neighborhoods are often overburdened by a disproportionate amount of pollution and do not have the resources or political influence to advocate for their citizens.
Almost 30 years later, the incoming Biden administration has committed itself to lifting up environmental justice as a key pillar to “righting wrongs in the communities that bear the brunt of pollution.” The transition team’s recent announcement of Michael Regan as Biden’s nominee to head the Environmental Protection Agency (EPA) was welcomed by environmental justice groups as a sign that it will be a priority for EPA in the coming years.
Data: Knowing Is Half the Battle
One of the barriers to addressing environmental justice is that it is difficult to identify communities that are overburdened in the first place. EPA, as well as other federal, state, and local programs, collect and maintain a vast array of environmental, health, and demographic data sets, and the technology available to us today offers tools to more easily identify where we should focus our resources to combat the environmental inequities that have persisted for decades.
But just because the data and analytical tool tools exist doesn’t mean that they are ready to be used. A recent article published by Vox highlighted how investments in better data and mapping tools could help us better understand the intersection between the environment, health outcomes, and our communities which, in turn, will enable us to focus federal resources on the areas with the greatest needs.
Getting a Real Look at the Problem
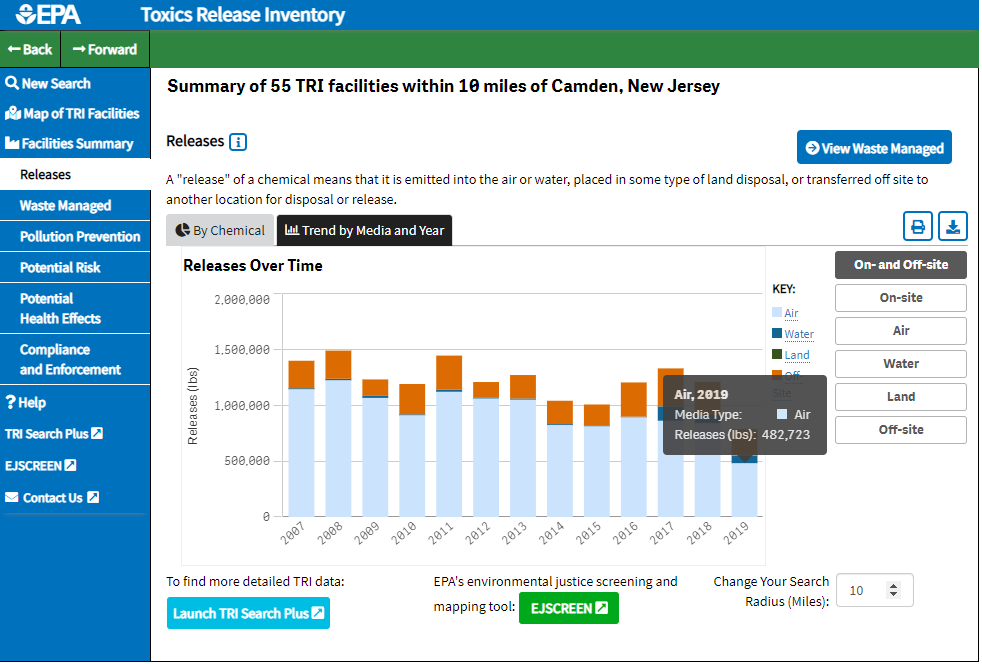
At Abt Global, we understand firsthand how the power of data analytics and visualization can fundamentally shift efforts to better understand sources of pollution and identify areas of concern. As one example, the Abt team helped EPA’s Toxics Release Inventory (TRI) Program launch a new search interface that incorporates data analytics technology to make it easier for users to find and understand the sources of potential pollution in their communities.
The TRI Program maintains more than 30 years of data on toxic chemical releases from industrial sources, including the type and quantity of chemical released, how it was released, and where it was released. The data visualization component of the TRI search tool provides maps, charts, and tables that quickly highlight toxic chemical air releases reported to the TRI Program. The new search tool identifies facilities that emit pollutants near a point of interest. With this upgrade, TRI could be used to, say, identify hundreds of thousands of pounds of air releases from the more than 50 TRI facilities located within just 10 miles of Camden, New Jersey. The state recently filed an environmental justice lawsuit over illegal dumping in that town; TRI would be a useful tool in cases such as this to help inform an understanding of the baseline pollution burden in different communities.
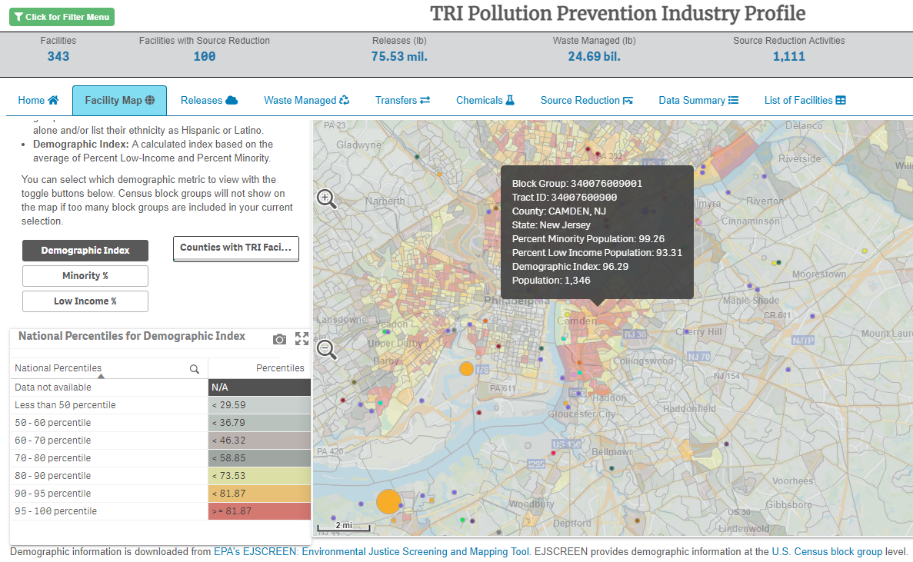
Other tools already in use by the TRI Program, including one that incorporates pollution prevention activities and U.S. Census data, can provide further insight about potential sources of exposure to pollution and opportunities for improving wellbeing by learning from what facilities around the country have already done to reduce pollution. Using data analytics and visualization, we can identify—and literally “see”—the trends often hidden in these large and sometimes complex resources. This data can point the way to solutions.
With Great Data Comes Great Analysis
Much of the data available to EPA and other agencies reflects the past and present state of our environment, but the mere presence of pollution now may not be the whole story for overburdened communities. A recent analysis by ProPublica showed that there are not only many existing chemical plants located in minority and low-income communities in Louisiana, but also new ones approved for development in those same areas that will add to the existing burden. ProPublica supported their analysis using EPA’s Risk-Screening Environmental Indicators (RSEI) model, which Abt Global updates annually by expanding upon TRI data with information about chemical toxicity, nearby populations, and fate and transport modeling to better characterize the potential risk from these releases. Their use of data analytics and visualization is an example of how we can use data to understand the potential future risk from pollution in communities, enabling stakeholders to act strategically rather than just respond.
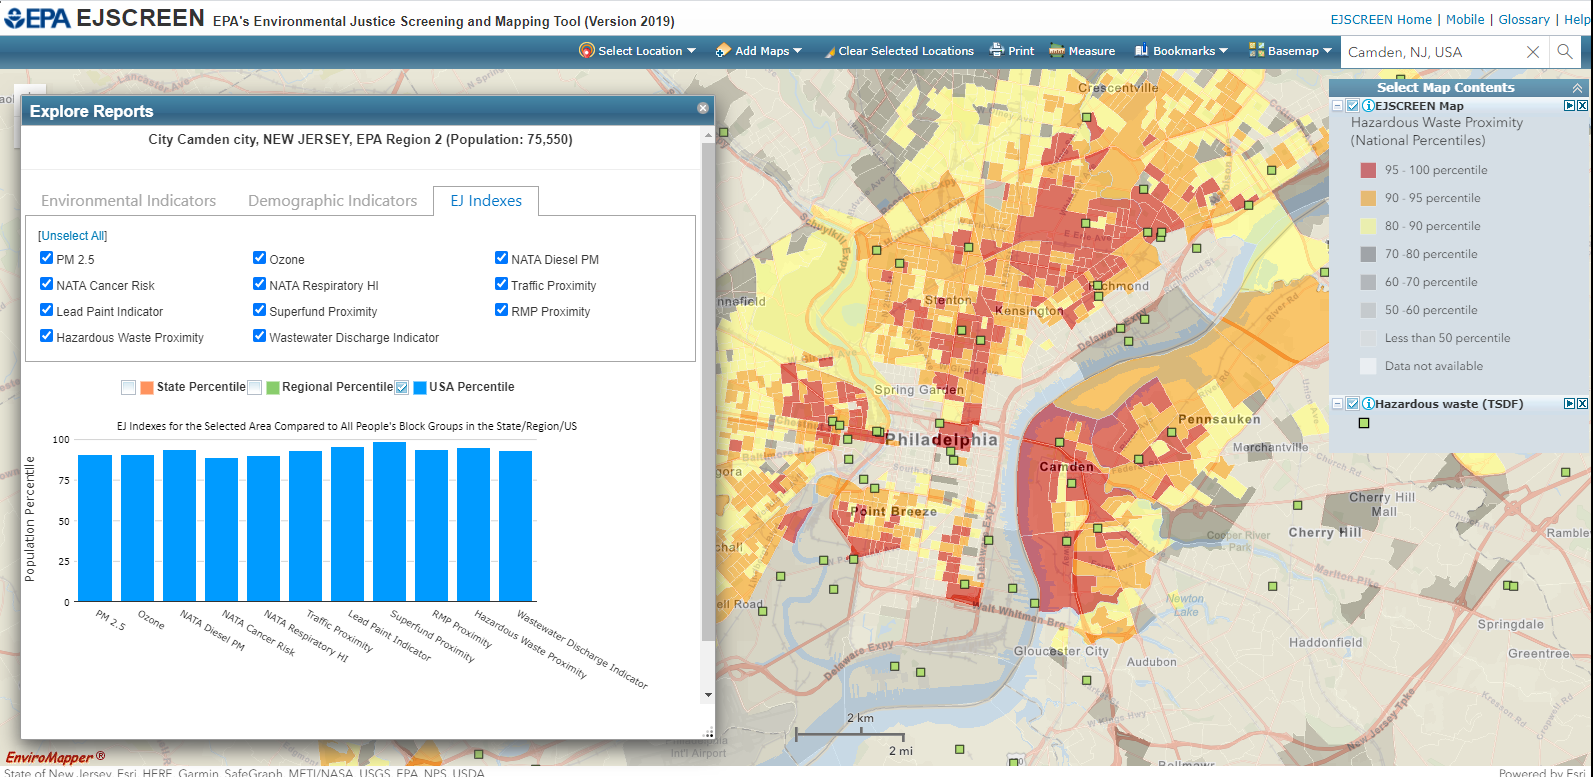
The power of data analytics and visualization is epitomized by EPA’s flagship environmental justice tool, EJSCREEN. This dashboard consolidates a broad suite of EPA program data, demographic data, and other geographical information to support conducting targeted analyses in specific communities, such as estimates of lead paint exposure and proximity to hazardous waste facilities. There are many ways that EJSCREEN could be improved and enhanced, and President-elect Biden has called for expanding on EJSCREEN to develop a Climate and Economic Justice Screening Tool to provide even more data-driven insights into identifying disadvantaged communities.
Addressing and resolving the environmental and health inequities in overburdened communities will always be a difficult task. In many cases, the data identifying environmental and health disparities exists—but we need to develop or improve tools to use that data appropriately and efficiently. Through the use of data analytics, geospatial analysis, and other technology-driven solutions, we can minimize the amount of time spent analyzing the data and identifying where disproportionate impacts occur, and instead focus more resources on developing the programs and policies to mitigate inequities in these communities.
Learn more about our Environmental Justice Tools and Services.